Victoria Market Report Infographics
INFOGRAPHICS: August 2025 VREB Victoria Market Reports

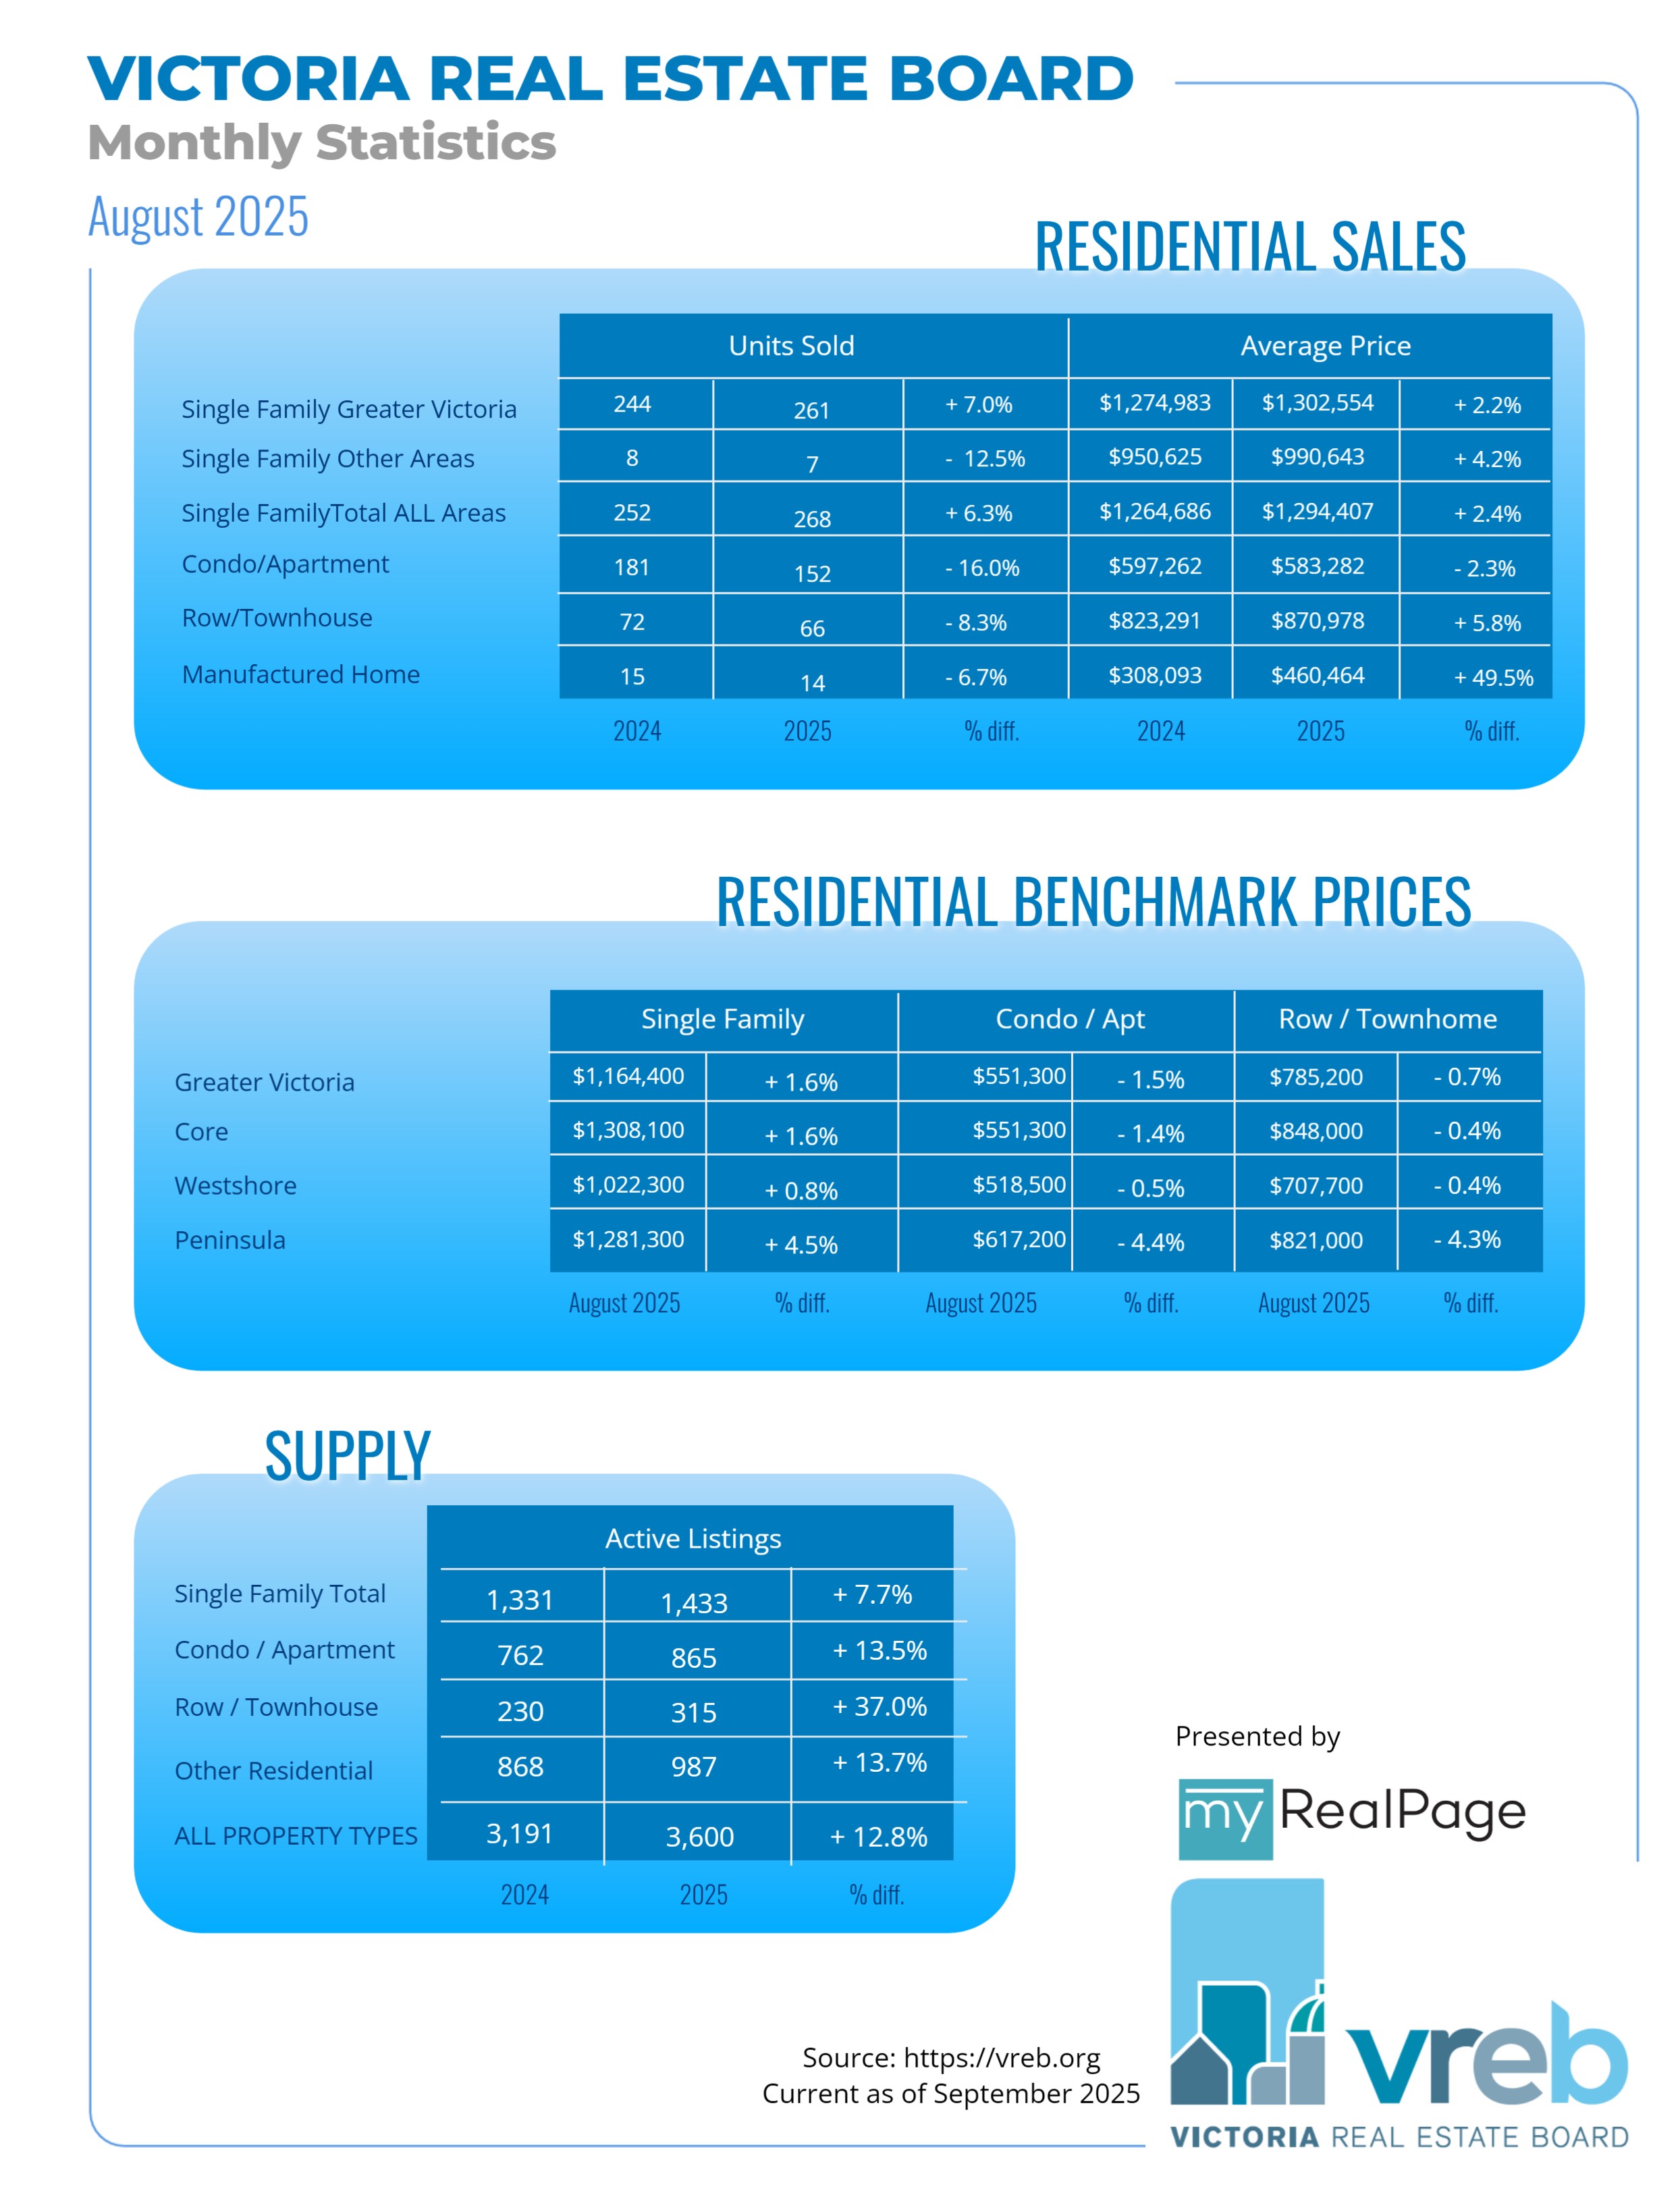
Victoria real estate market quiet but steady to end summer
A total of 525 properties sold in the Victoria Real Estate Board region this August, 3.7 per cent fewer than the 545 properties sold in August 2024 and 22.8 per cent fewer than in July 2025. Sales of condominiums decreased by 16 per cent from August 2024 with 152 units sold. Sales of single family homes increased by 6.3 per cent from August 2024 with 268 sold.
“August was a quiet but steady month,” said 2025 Victoria Real Estate Board Chair Dirk VanderWal. “Typical of what we’d expect for the time of year, the late summer month saw fewer sales and a small decrease in the available listings. Many people shift focus to vacations and back to school preparation in August. Home buying, selling, and moving projects are often put on hold until fall. Some sellers use the month to prepare their home for listing in the busier fall market.”
There were 3,600 active listings for sale on the Victoria Real Estate Board Multiple Listing Service® at the end of August 2025, a decrease of 2.8 per cent compared to the previous month of July and a 12.8 per cent increase from the 3,191 active listings for sale at the end of August 2024.
Read the full report on VREB website!
The following data is a comparison between August 2025 and August 2024 numbers, and is current as of September 2025. Click here to check out last month’s figures!
You can also follow this link for all our Victoria Board monthly infographics!
Click on the images for a larger view!
Download Printable Version – August 2025 VREB, Victoria Market Report
INFOGRAPHICS: July 2025 VREB Victoria Market Reports
Victoria real estate market offers good options over the summer months
A total of 680 properties sold in the Victoria Real Estate Board region this July, 4.6 per cent more than the 650 properties sold in July 2024 and 10.6 per cent fewer than in June 2025. Sales of condominiums increased by 5.6 per cent from July 2024 with 225 units sold. Sales of single family homes decreased by 0.3 per cent from July 2024 with 318 sold.
“Typically, as the school year wraps up and summer holidays begin, our housing market relaxes somewhat,” said 2025 Victoria Real Estate Board Chair Dirk VanderWal. “However, we did see a good pace of sales in July, and listing inventory remained at a stable level. This means that those shopping over the summer will have a good selection of homes to consider but it also means there is enough market activity that we could see some properties go into multiple offers.”
There were 3,703 active listings for sale on the Victoria Real Estate Board Multiple Listing Service® at the end of July 2025, a decrease of 2 per cent compared to the previous month of June and a 10.6 per cent increase from the 3,348 active listings for sale at the end of July 2024.
Read the full report on VREB website!
The following data is a comparison between July 2025 and July 2024 numbers, and is current as of August 2025. Click here to check out last month’s figures!
You can also follow this link for all our Victoria Board monthly infographics!
Click on the images for a larger view!
Download Printable Version – July 2025 VREB, Victoria Market Report

INFOGRAPHICS: June 2025 VREB Victoria Market Reports
Victoria real estate market kicks off summer with strong fundamentals
A total of 761 properties sold in the Victoria Real Estate Board region this June, 15.1 per cent more than the 661 properties sold in June 2024 and 0.4 per cent more than in May 2025. Sales of condominiums increased by 23.3 per cent from June 2024 with 249 units sold. Sales of single family homes increased by 17.5 per cent from June 2024 with 402 sold.
“We observed a fairly robust real estate market in the month of June,” said 2025 Victoria Real Estate Board Chair Dirk VanderWal. “Recent market trends suggest that we have finally transitioned from apandemic-driven market to more conventional patterns. We have experienced consecutive months of a healthy and balanced market that includes listing inventory levels we have not seen in a decade paired with steady sales. Despite economic uncertainties weighing on consumer confidence, Victoria continues to demonstrate resilient market conditions.”
Read the full report on VREB website!
The following data is a comparison between June 2025 and June 2024 numbers, and is current as of July 2025. Click here to check out last month’s figures!
You can also follow this link for all our Victoria Board monthly infographics!
Click on the images for a larger view!
Download Printable Version – June 2025 VREB, Victoria Market Report

INFOGRAPHICS: May 2025 VREB Victoria Market Reports
A stable real estate market trend continues in Victoria, BC
A total of 758 properties sold in the Victoria Real Estate Board region this May, 0.7 per cent fewer than the 763 properties sold in May 2024 but 18.1 per cent more than in April 2025. Sales of condominiums decreased by 6 per cent from May 2024 with 221 units sold. Sales of single family homes increased by 0.5 per cent from May 2024 with 401 sold.
“Victoria’s real estate market in the month of May was positive for consumers on both sides of the transaction,” said 2025 Victoria Real Estate Board Chair Dirk VanderWal. “Ample inventory coming to market outpaced brisk sales, which provided a consistent amount of choice and eased competition on high-demand properties. More balanced market conditions were supported by stability both in prices and in interest rates. The May market was resilient, and that steady pace is a little boring to report on but has been much more comfortable for buyers and sellers to navigate than markets we’ve seen in past years.”
Read the full report on VREB website!
The following data is a comparison between May 2025 and May 2024 numbers, and is current as of June 2025. Click here to check out last month’s figures!
You can also follow this link for all our Victoria Board monthly infographics!
Click on the images for a larger view!
Download Printable Version – May 2025 VREB, Victoria Market Report

INFOGRAPHICS: April 2025 VREB Victoria Market Reports
Victoria real estate activity tempered by political and economic uncertainty
A total of 642 properties sold in the Victoria Real Estate Board region this April, 5.3 per cent fewer than the 678 properties sold in April 2024 but 4.7 per cent more than in March 2025. Sales of condominiums decreased by 10.1 per cent from April 2024 with 187 units sold. Sales of single family homes decreased by 0.6 per cent from April 2024 with 335 sold.
“While sales were up from March, activity in April was most likely impacted by events in play well beyond our immediate real estate market,” said 2025 Victoria Real Estate Board Chair Dirk VanderWal. “Political uncertainty associated with the federal election, combined with broader economic concerns stemming from the United States tempered our spring market growth. And yet like last month, despite these external factors, the Victoria market demonstrated continued stability, as evidenced by flat price growth and steady inventory levels.”
There were 3,425 active listings for sale on the Victoria Real Estate Board Multiple Listing Service® at the end of April 2025, an increase of 13.3 per cent compared to the previous month of March and a 13.5 per cent increase from the 3,017 active listings for sale at the end of April 2024.
Read the full report on VREB website!
The following data is a comparison between April 2025 and April 2024 numbers, and is current as of May 2025. Click here to check out last month’s figures!
You can also follow this link for all our Victoria Board monthly infographics!
Click on the images for a larger view!
Download Printable Version – April 2025 VREB, Victoria Market Report

INFOGRAPHICS: March 2025 VREB Victoria Market Reports
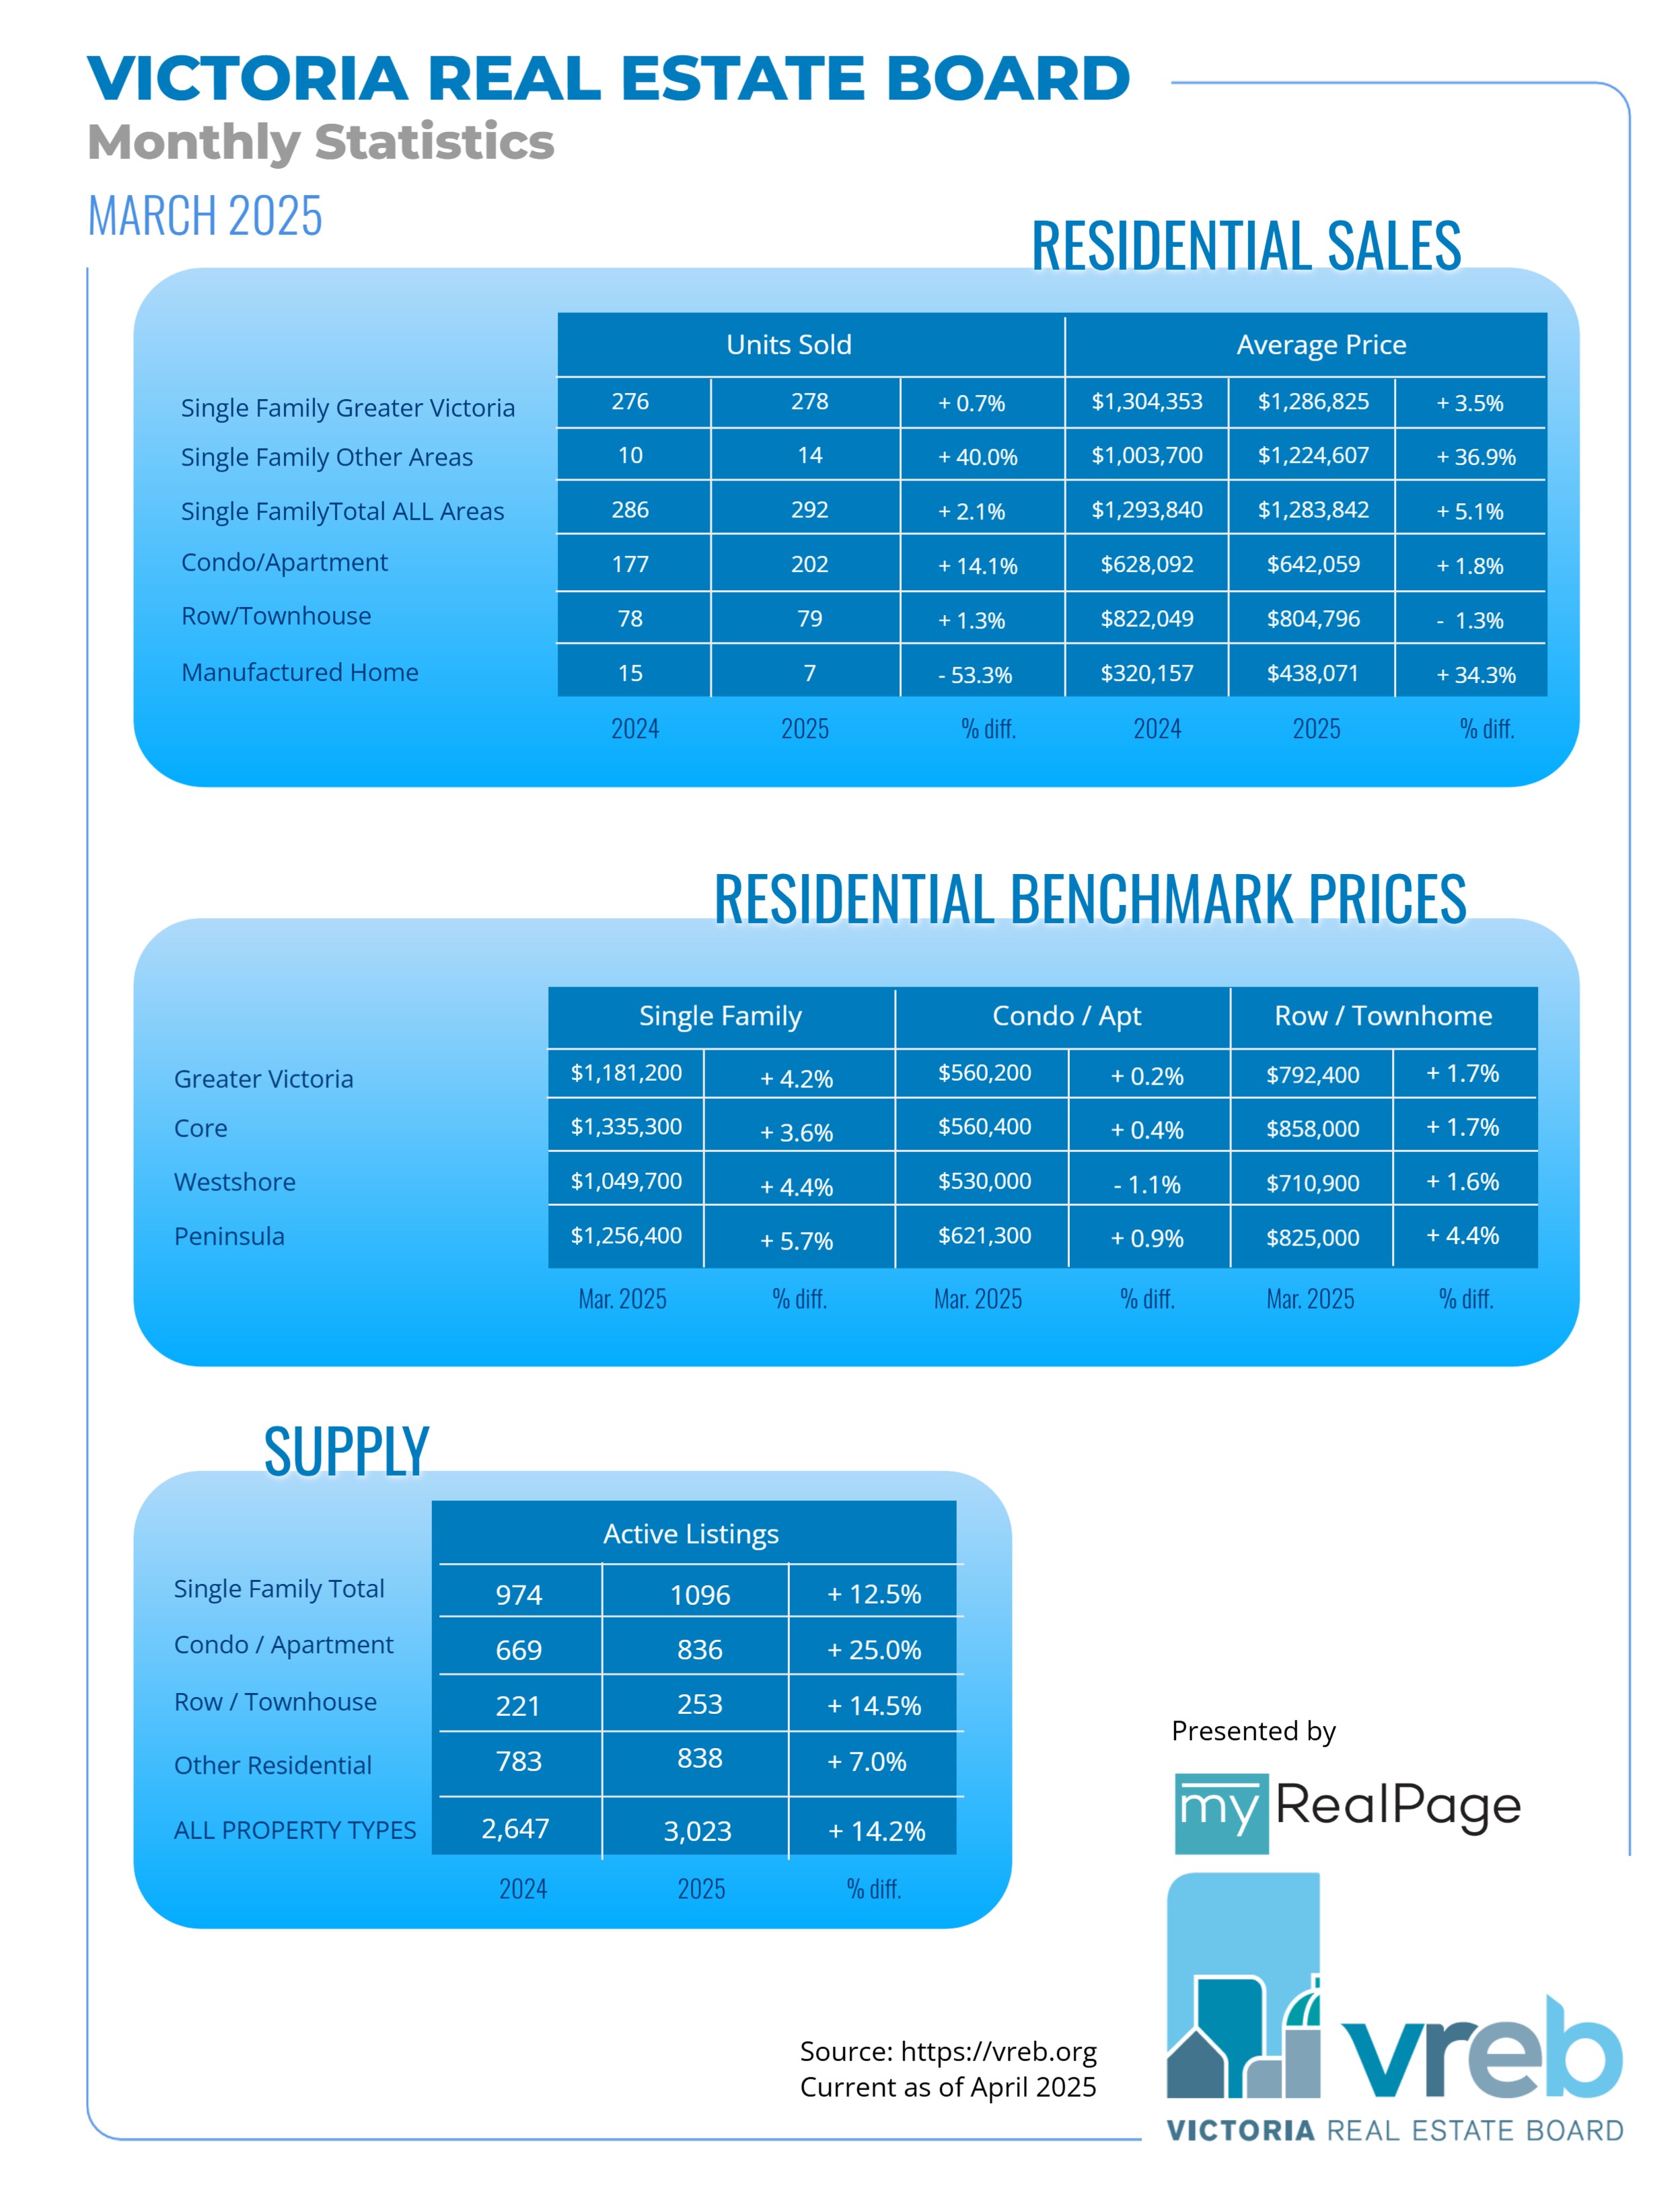
Victoria real estate market stable in the face of uncertainty
A total of 613 properties sold in the Victoria Real Estate Board region this March, 4.3 per cent more than the 588 properties sold in March 2024 and 16.1 per cent more than in February 2025. Sales of condominiums were up 14.1 per cent from March 2024 with 202 units sold. Sales of single family homes increased by 2.1 per cent from March 2024 with 292 sold.
“The economic uncertainty the world faces right now certainly colours our local real estate market,” said 2025 Victoria Real Estate Board Chair Dirk VanderWal. “In spite of this, our market remains as it has in recent months – stable and balanced. Inventory levels this past month held steady at over three thousand listings, which meant that there was a good amount of selection for buyers, while relatively flat pricing meant more predictability for sellers and buyers.”
There were 3,023 active listings for sale on the Victoria Real Estate Board Multiple Listing Service® at the end of March 2025, an increase of 14.9 per cent compared to the previous month of February and an 14.2 per cent increase from the 2,647 active listings for sale at the end of March 2024. “As in past months, the balanced market in March softened the demand-side pressures of markets we’ve seen in recent years. There is more time for decision making, which is a positive aspect for both sellers and buyers,” adds Chair VanderWal.
“Thoughtfully priced and presented homes are selling well and we do see instances of multiple offers, which is often a hallmark of the spring market. For the best outcomes in your property search or sale, connect with your favourite local REALTOR® to navigate the current market.
Read the full report on VREB website!
The following data is a comparison between March 2025 and March 2024 numbers, and is current as of April 2025. Click here to check out last month’s figures!
You can also follow this link for all our Victoria Board monthly infographics!
Click on the images for a larger view!
Download Printable Version – March 2025 VREB, Victoria Market Report
INFOGRAPHICS: February 2025 VREB Victoria Market Reports
February a steady month for Greater Victoria buyers and sellers
A total of 528 properties sold in the Victoria Real Estate Board region this February, 12.3 per cent more than the 470 properties sold in February 2024 and 25.1 per cent more than in January 2025. Sales of condominiums were up 26.3 per cent from February 2024 with 192 units sold. Sales of single family homes increased by 4.5 per cent from February 2024 with 234 sold.
“February was another stable month for local real estate,” said 2025 Victoria Real Estate Board Chair Dirk VanderWal. “The combination of slowly growing inventory and slightly increased sales means that our market remains in balance from the start of the year, which creates comfortable conditions for both buyers and sellers. Nearly two years of steady prices combined with recent favourable interest rates are positive factors for our market. Thus far, 2025 has been a good year to buy and sell.”
There were 2,630 active listings for sale on the Victoria Real Estate Board Multiple Listing Service® at the end of February 2025, an increase of 9.8 per cent compared to the previous month of January and an 11.3 per cent increase from the 2,364 active listings for sale at the end of February 2024.
Read the full report on VREB website!
The following data is a comparison between February 2025 and February 2024 numbers, and is current as of March 2025. Click here to check out last month’s figures!
You can also follow this link for all our Victoria Board monthly infographics!
Click on the images for a larger view!
Download Printable Version – February 2025 VREB, Victoria Market Report

INFOGRAPHICS: January 2025 VREB Victoria Market Reports
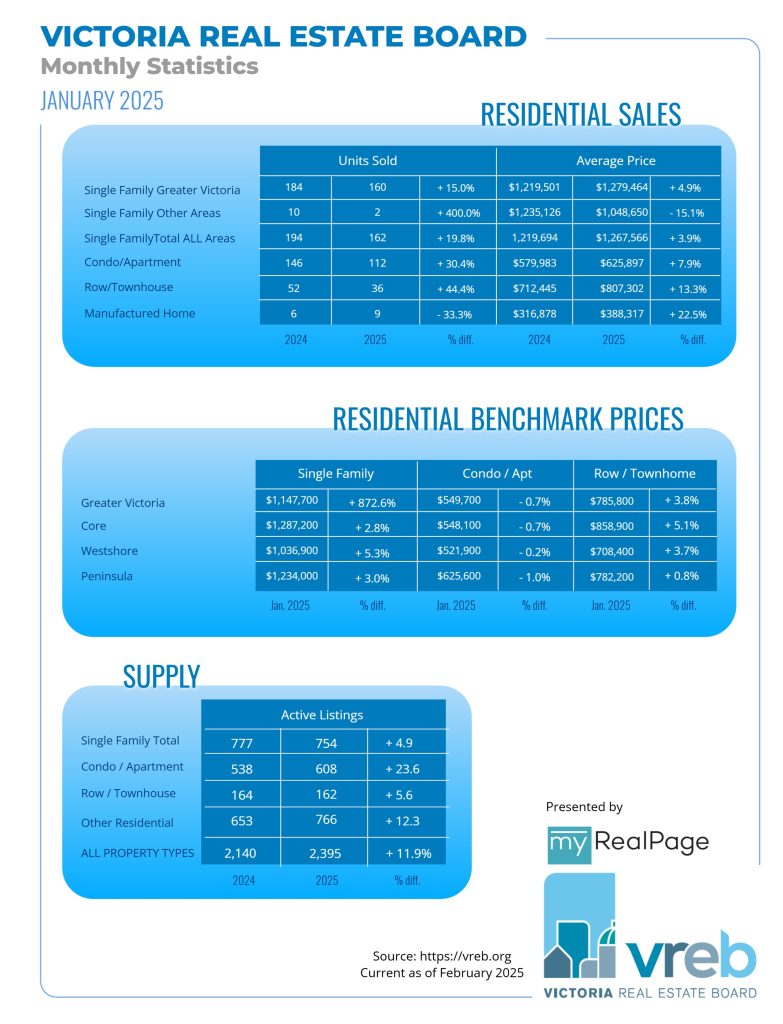
2025 housing market kicks off with good balance of inventory and stable pricing
A total of 422 properties sold in the Victoria Real Estate Board region this January, 23.8 per cent more than the 341 properties sold in January 2024 and 0.2 per cent more than in December 2024. Sales of condominiums were up 30.4 per cent from January 2024 with 146 units sold. Sales of single family homes increased by 19.8 per cent from January 2024 with 194 sold.
“We’ve seen a strong hand off from the December market to January with a good sense of momentum building,” said 2025 Victoria Real Estate Board Chair Dirk VanderWal. “Over the course of the month, we saw an uptick in new listings, and it is the first time in ten years that over one thousand new listings were added to our inventory in a January. This is a positive sign for our market as we head into 2025.”
There were 2,395 active listings for sale on the Victoria Real Estate Board Multiple Listing Service® at the end of January 2025, an increase of 4.6 per cent compared to the previous month of December and an 11.9 per cent increase from the 2,140 active listings for sale at the end of January 2024.
Read the full report on VREB website!
The following data is a comparison between January 2025 and January 2024 numbers, and is current as of February 2025. Click here to check out last month’s figures!
You can also follow this link for all our Victoria Board monthly infographics!
Click on the images for a larger view!
Download Printable Version – January 2025 VREB, Victoria Market Report
INFOGRAPHICS: December 2024 VREB Victoria Market Reports
2024 Victoria real estate market year in review
A total of 421 properties sold in the Victoria Real Estate Board region this December, 28 per cent more than the 329 properties sold in December 2023 and a 23.6 per cent decrease from November 2024. Sales of condominiums were up 25 per cent from December 2023 with 135 units sold. Sales of single family homes increased 20.9 per cent from December 2023 with 191 sold.
A grand total of 6,893 properties sold over the course of 2024, an 11 per cent increase from the 6,207 sold in 2023.
“2024 was a fairly calm year for local real estate,” said 2024 Victoria Real Estate Board Chair Laurie Lidstone. “And this is what we like to see for consumers! It has been a year of stability and predictability. Prices have been relatively level for the past two years now, which has made it easier for buyers and sellers to navigate transactions with confidence. Even though 2024 had more months with over 3,000 listings than we have had in many years, we do continue to see low inventory levels when compared to long term averages. If inventory remains low and we see an increase in demand, we could very quickly return to a market where there is upward pressure on pricing. This is why the Board will continue to advocate for gentle density development in 2025.”
Read the full report on VREB website!
The following data is a comparison between December 2024 and December 2023 numbers, and is current as of January 2025. Click here to check out last month’s figures!
You can also follow this link for all our Victoria Board monthly infographics!
Click on the images for a larger view!
Download Printable Version – November 2024 VREB, Victoria Market Report

INFOGRAPHICS: November 2024 VREB Victoria Market Reports
A warm start to winter sales in the Victoria real estate market
A total of 551 properties sold in the Victoria Real Estate Board region this November, 39.8 per cent more than the 394 properties sold in November 2023 and a 15.7 per cent decrease from October 2024. Sales of condominiums were up 55 per cent from November 2023 with 186 units sold. Sales of single family homes increased by 36.3 per cent from November 2023 with 263 sold.
“I’ve found that buyers and sellers are feeling optimistic right now,” said 2024 Victoria Real Estate Board Chair Laurie Lidstone. “With the steady decrease we’ve seen in interest rates and the continued balance in the market, consumers are feeling more comfortable and empowered to make the big decisions around home ownership knowing that they have a fairly stable real estate environment to navigate.”
There were 2,836 active listings for sale on the Victoria Real Estate Board Multiple Listing Service® at the end of November 2024, a decrease of 10.3 per cent compared to the previous month of October and a 7.3 per cent increase from the 2,644 active listings for sale at the end of November 2023.
Read the full report on VREB website!
The following data is a comparison between November 2024 and November 2023 numbers, and is current as of December 2024. Click here to check out last month’s figures!
You can also follow this link for all our Victoria Board monthly infographics!
Click on the images for a larger view!
Download Printable Version – November 2024 VREB, Victoria Market Report

Sheryl Jardine
Royal LePage Duncan Realty
Office Address:
371 Festubert Street
Duncan, BC, V9L 3T1